Welcome to our comprehensive guide on the top 10 reporting tools for greater insight in 2025! In today's data-driven world, businesses rely heavily on reporting tools to analyze and visualize their data effectively. These tools not only provide valuable insights but also help in making informed decisions. In this article, we will explore the key features, pros and cons, price points, and best use cases of the top 10 reporting tools available in the market.
1. Google Data Studio
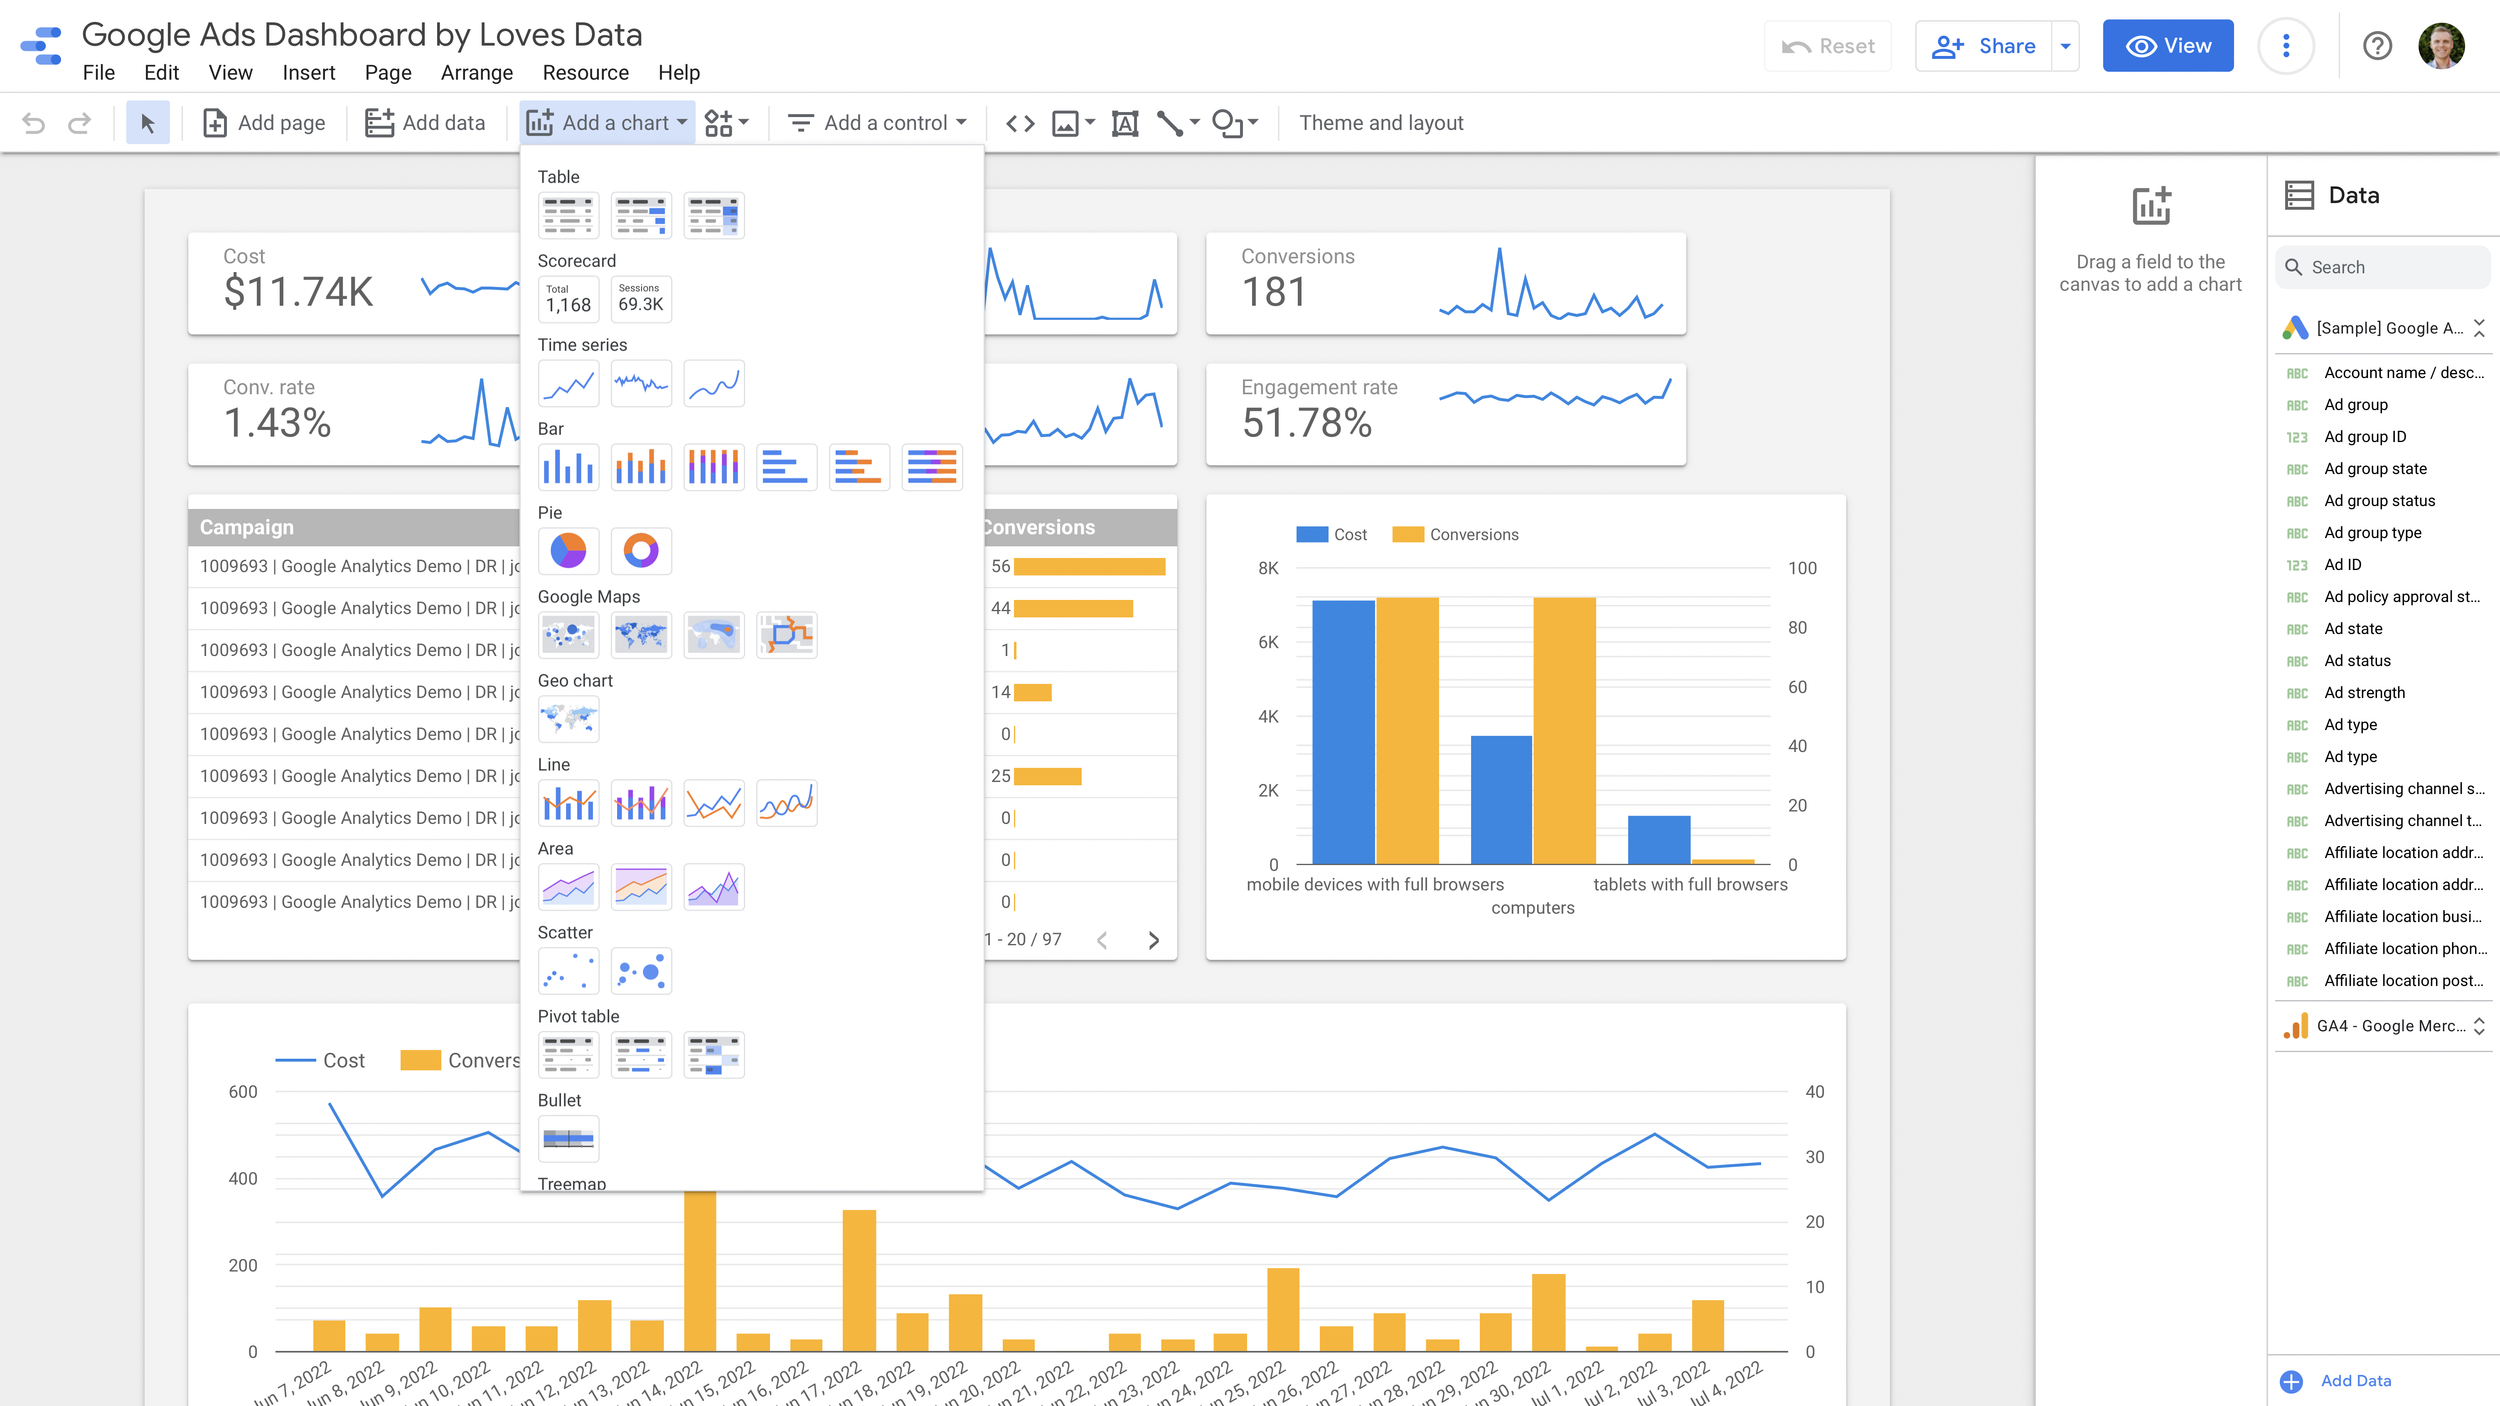
Google Data Studio is a powerful reporting tool that allows users to create interactive dashboards and reports. It offers a wide range of data connectors, making it easy to connect and visualize data from various sources. Let's dive deeper into the key aspects of Google Data Studio:
Price Point
Google Data Studio offers a free version with limited features, which is suitable for small businesses and individuals. For advanced features and increased data storage, users can opt for the paid version, which starts at $200 per month.
Pros and Cons
One of the major advantages of Google Data Studio is its seamless integration with other Google products, such as Google Analytics and Google Sheets. This makes it easy to import and analyze data from these sources. Additionally, the tool offers a user-friendly interface with drag-and-drop functionality, making it accessible to users with varying technical expertise.
However, one limitation of Google Data Studio is its limited customization options compared to other reporting tools. Users may find it challenging to create complex visualizations or customize the appearance of their reports.
Unique Features
Google Data Studio stands out with its collaboration features. Multiple users can work on the same report simultaneously, making it ideal for teams. The tool also allows users to embed reports on websites or share them via a link, enabling easy sharing of insights with stakeholders.
Best Use Cases
Google Data Studio is an excellent choice for businesses that heavily rely on Google products for data analysis. It is particularly useful for marketing teams, as it seamlessly integrates with Google Analytics and Google Ads, allowing marketers to track and visualize campaign performance.
2. Tableau
Tableau is a leading reporting and data visualization tool known for its robust features and intuitive interface. Let's explore what makes Tableau a popular choice among data professionals:

Price Point
Tableau offers multiple pricing options, including a free version called Tableau Public. The paid versions, Tableau Creator, Tableau Explorer, and Tableau Viewer, cater to different user needs and start at $70 per user per month.
Pros and Cons
Tableau's strength lies in its extensive range of visualization options. Users can create interactive dashboards and reports with ease, thanks to its drag-and-drop functionality. The tool also offers advanced analytics capabilities, such as forecasting and statistical modeling.
However, one drawback of Tableau is its relatively steep learning curve. Users with limited technical skills may find it challenging to fully utilize the tool's capabilities without proper training.
Unique Features
Tableau shines in its ability to handle large datasets efficiently. It offers robust data blending and aggregation capabilities, allowing users to combine data from multiple sources seamlessly. The tool also provides real-time data updates, ensuring that insights are always up to date.
Best Use Cases
Tableau is widely used across industries for data analysis and visualization. It is particularly popular in the finance sector for financial reporting and analysis. Marketing teams also benefit from Tableau's ability to create visually appealing dashboards to track campaign performance.
3. Power BI
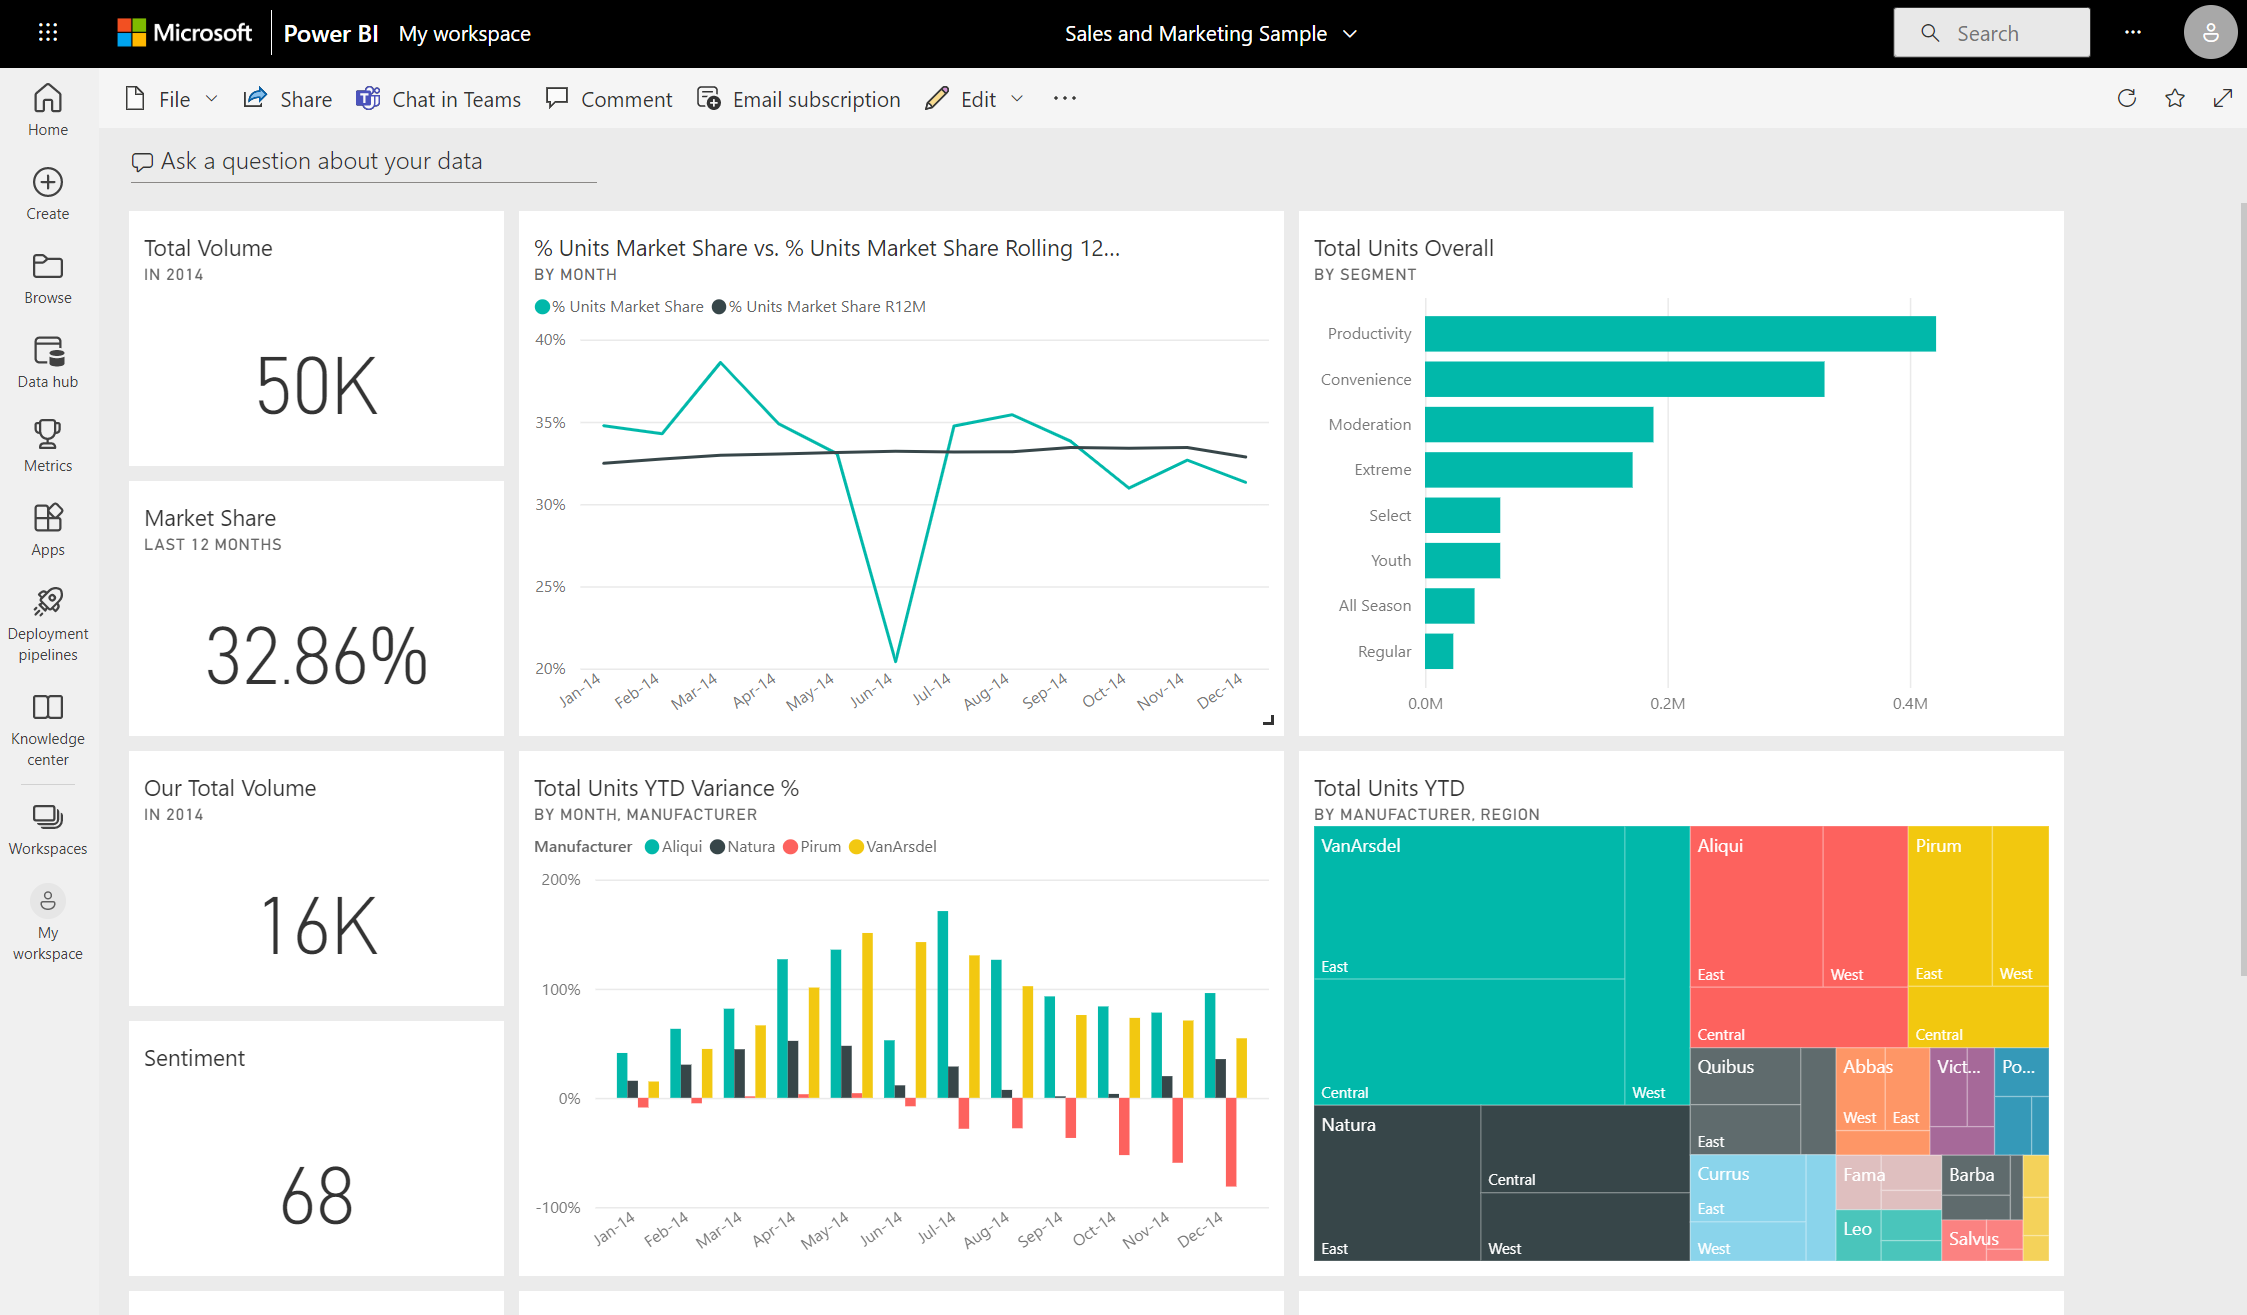
Power BI is Microsoft's flagship reporting and business intelligence tool. It offers a comprehensive suite of features for data analysis and visualization. Let's delve into the key aspects of Power BI:
Price Point
Power BI offers a free version with limited features, making it accessible to individuals and small businesses. The paid versions, Power BI Pro and Power BI Premium, cater to enterprise-level needs and start at $9.99 per user per month.
Pros and Cons
One of Power BI's strengths is its seamless integration with other Microsoft products, such as Excel and Azure. This makes it easy to import and analyze data from these sources. The tool also offers a user-friendly interface with drag-and-drop functionality, similar to Excel.
However, Power BI's visualization options are not as extensive as some other reporting tools. Users may find it challenging to create complex visualizations or customize the appearance of their reports.
Unique Features
Power BI stands out with its natural language query feature, which allows users to ask questions in plain English and receive relevant visualizations. The tool also offers robust collaboration features, such as the ability to share reports and dashboards with stakeholders.
Best Use Cases
Power BI is an excellent choice for businesses that heavily rely on Microsoft products for data analysis. It is particularly useful for finance teams, as it seamlessly integrates with Excel, allowing for easy data import and analysis. Sales teams can also benefit from Power BI's ability to create interactive dashboards to track sales performance.
4. Looker
Looker is a powerful data platform that offers a wide range of reporting and analytics capabilities. Let's explore what sets Looker apart:

Price Point
Looker's pricing is based on a quote system, tailored to each customer's specific needs. This makes it suitable for businesses of all sizes, as pricing can be customized according to requirements.
Pros and Cons
Looker's strength lies in its data modeling capabilities. The tool allows users to create a semantic layer, which acts as a single source of truth for data. This makes it easy to maintain consistency across reports and ensures that everyone is working with the same data.
However, Looker's learning curve can be steep for users with limited technical skills. It requires a solid understanding of data modeling concepts and SQL to fully utilize its capabilities.
Unique Features
Looker stands out with its embedded analytics feature. Users can embed Looker dashboards and reports directly into their applications or websites, providing stakeholders with real-time insights without the need to switch between tools.
Best Use Cases
Looker is well-suited for businesses that require advanced data modeling capabilities. It is particularly popular among e-commerce companies for tracking customer behavior and analyzing sales data. Additionally, Looker's embedded analytics feature makes it an ideal choice for software companies looking to provide analytics capabilities within their products.
5. QlikView
QlikView is a powerful reporting and data discovery tool known for its associative data model. Let's explore what makes QlikView a popular choice among data professionals:

Price Point
QlikView's pricing is based on a quote system, tailored to each customer's specific needs. This makes it suitable for businesses of all sizes, as pricing can be customized according to requirements.
Pros and Cons
One of QlikView's strengths is its associative data model, which allows users to explore data intuitively. Users can navigate through data without predefined paths, making it easy to discover hidden insights. The tool also offers powerful data visualization options.
However, QlikView's learning curve can be steep for users with limited technical skills. It requires a solid understanding of data modeling concepts and QlikView's scripting language to fully utilize its capabilities.
Unique Features
QlikView stands out with its in-memory data processing capabilities. The tool loads data into memory, allowing for fast and interactive data exploration. Users can analyze large datasets without the need for complex database queries.
Best Use Cases
QlikView is widely used across industries for data analysis and discovery. It is particularly popular in the retail sector for analyzing sales data and identifying trends. Supply chain teams also benefit from QlikView's ability to analyze and visualize complex supply chain data.
6. Domo
Domo is a cloud-based reporting and business intelligence platform that offers a wide range of features for data analysis and visualization. Let's delve into the key aspects of Domo:
Price Point
Domo's pricing is based on a quote system, tailored to each customer's specific needs. This makes it suitable for businesses of all sizes, as pricing can be customized according to requirements.
Pros and Cons
Domo's strength lies in its ease of use. The tool offers a user-friendly interface with drag-and-drop functionality, making it accessible to users with varying technical expertise. Domo also provides a wide range of pre-built connectors, making it easy to connect and analyze data from various sources.
However, Domo's customization options are not as extensive as some other reporting tools. Users may find it challenging to create complex visualizations or customize the appearance of their reports.
Unique Features
Domo stands out with its mobile app, which allows users to access reports and dashboards on the go. The app provides real-time data updates, ensuring that insights are always at users' fingertips.
Best Use Cases
Domo is well-suited for businesses that require a cloud-based reporting and analytics platform. It is particularly popular among sales teams for tracking sales performance and pipeline management. Additionally, Domo's mobile app makes it an ideal choice for executives who need access to real-time insights on their smartphones or tablets.
7. Sisense
Sisense is a robust reporting and analytics platform known for its powerful data modeling capabilities. Let's explore what sets Sisense apart:
Price Point
Sisense's pricing is based on a quote system, tailored to each customer's specific needs. This makes it suitable for businesses of all sizes, as pricing can be customized according to requirements.
Pros and Cons
Sisense's strength lies in its ability to handle large and complex datasets. The tool offers advanced data modeling capabilities, allowing users to create a semantic layer for data analysis. Sisense also provides a wide range of visualization options.
However, Sisense's learning curve can be steep for users with limited technical skills. It requires a solid understanding of data modeling concepts and Sisense's scripting language to fully utilize its capabilities.
Unique Features
Sisense stands out with its AI-powered analytics feature. The tool uses machine learning algorithms to automatically detect patterns and anomalies in data, providing users with valuable insights without the need for manual analysis.
Best Use Cases
Sisense is well-suited for businesses that require advanced data modeling capabilities. It is particularly popular in the healthcare sector for analyzing patient data and identifying trends. Finance teams also benefit from Sisense's ability to create complex financial reports and perform financial forecasting.
8. IBM Cognos Analytics
IBM Cognos Analytics is a comprehensive reporting and business intelligence tool that offers a wide range of features for data analysis and visualization. Let's delve into the key aspects of IBM Cognos Analytics:

Price Point
IBM Cognos Analytics offers multiple pricing options, including a free trial. The paid versions cater to different user needs and start at $15 per user per month.
Pros and Cons
One of IBM Cognos Analytics' strengths is its robust reporting capabilities. The tool offers a wide range of reporting options, including pixel-perfect reports and interactive dashboards. IBM Cognos Analytics also provides advanced analytics capabilities, such as predictive modeling.
However, IBM Cognos Analytics' user interface can be overwhelming for users with limited technical skills. It requires some training to fully utilize its capabilities.
Unique Features
IBM Cognos Analytics stands out with its AI-powered assistant, which provides users with natural language insights and recommendations. The assistant can answer questions, perform data analysis, and guide users in creating reports and visualizations.
Best Use Cases
IBM Cognos Analytics is widely used across industries for data analysis and reporting. It is particularly popular in the manufacturing sector for analyzing production data and optimizing processes. Human resources teams also benefit from IBM Cognos Analytics' ability to create comprehensive HR reports and analyze employee data.
9. Yellowfin
Yellowfin is a reporting and analytics platform known for its ease of use and intuitive interface. Let's explore what makes Yellowfin a popular choice among data professionals:

Price Point
Yellowfin's pricing is based on a quote system, tailored to each customer's specific needs. This makes it suitable for businesses of all sizes, as pricing can be customized according to requirements.
Pros and Cons
Yellowfin's strength lies in its user-friendly interface. The tool offers a drag-and-drop functionality, making it accessible to users with varying technical expertise. Yellowfin also provides a wide range of visualization options.
However, Yellowfin's customization options are not as extensive as some other reporting tools. Users may find it challenging to create complex visualizations or customize the appearance of their reports.
Unique Features
Yellowfin stands out with its storytelling feature, which allows users to create narrative-driven reports and presentations. Users can combine data visualizations with text and images to tell a compelling data story.
Best Use Cases
Yellowfin is well-suited for businesses that require an easy-to-use reporting and analytics platform. It is particularly popular in the education sector for analyzing student performance data and tracking educational outcomes. Marketing teams also benefit from Yellowfin's ability to create visually appealing reports to track campaign performance.
10. Zoho Analytics
Zoho Analytics is a comprehensive reporting and business intelligence tool that offers a wide range of features for data analysis and visualization. Let's delve into the key aspects of Zoho Analytics:
Price Point
Zoho Analytics offers multiple pricing options, including a free version with limited features. The paid versions cater to different user needs and start at $22 per user per month.
Pros and Cons
Zoho Analytics' strength lies in its seamless integration with other Zoho products, such as Zoho CRM and Zoho Books. This makes it easy to import and analyze data from these sources. The tool also offers a user-friendly interface with drag-and-drop functionality.
However, Zoho Analytics' customization options are not as extensive as some other reporting tools. Users may find it challenging to create complex visualizations or customize the appearance of their reports.
Unique Features
Zoho Analytics stands out with its AI-powered assistant, which provides users with natural language insights and recommendations. The assistant can answer questions, perform data analysis, and guide users in creating reports and visualizations.
Best Use Cases
Zoho Analytics is widely used across industries for data analysis and reporting. It is particularly popular in the sales sector for analyzing sales data and tracking sales performance. Additionally, Zoho Analytics' integration with other Zoho products makes it an ideal choice for businesses that rely on Zoho's suite of applications.
With these top 10 reporting tools at your disposal, you can gain greater insight into your data and make informed decisions. Whether you're a small business or a large enterprise, there's a reporting tool that suits your needs. Consider the price points, pros and cons, unique features, and best use cases of each tool to find the perfect fit for your organization. Start harnessing the power of data today!